

To keep up with the competition, you need to constantly optimize your manufacturing operations. As they say, “You can’t improve what you don’t measure.”
To help you measure your business’ performance, we have compiled some key performance indicators (KPIs). Using the KPIs, you can effectively gauge your manufacturing performance and compare the benchmarks over time. The KPIs are segregated based on overall production, equipment, employees, and customers — providing a holistic report of your business.


Here are the manufacturing KPIs that you should consider:
Production KPIs
1. Throughput
Throughput is one of the most crucial metrics for production management, arguably the ultimate measure of your manufacturing unit’s productivity. Throughput reflects the volume of your production. In other words, how much you can produce in a specific time period.
Let’s understand with an example. Let’s say your production staff works an eight-hour shift and produces 560 units. The throughput rate would be 70 units per hour (560 units / 8 hours).
2. Cycle time
The throughput shows the volume that you can produce in a time period, while cycle time shows the time taken to finish the production. Cycle time shows how long it takes to transform raw materials into the finished product. You can use cycle time to evaluate the time taken to make the finished product or the time it takes to manufacture individual components required for the production process. Calculating the cycle time is very easy.
Cycle time = Process End Time – Process Start Time.
If you started the production at 8 AM and the final product was made by 11 AM, your cycle time is three hours (11 AM – 8 AM).
Equipment KPIs
1. Overall equipment effectiveness (OEE)
This metric measures the overall effectiveness of production equipment or the entire line.
The overall equipment effectiveness KPI requires three components: Availability, performance, and quality. Let’s understand each component.
A) Availability
Availability measures the actual operating time of equipment with the total available time. Let’s assume that the working shift is eight hours per day. But there was one hour of downtime, so the machine could only operate for seven hours.
Availability = Actual Utilization Time / Total Available Time
So availability = 7 / 8 = 0.8750 (87.5%)
B) Performance
This measure compares the time it takes to finish the production with the ideal completion time.
Continuing with the previous example, your factory is operating for seven hours.
Let’s say the machines can ideally produce one unit in 12 minutes (i.e., 0.2 hours). Thus, in a 420-minute (7-hour) shift, you can ideally manufacture 35 units (7/0.2). However, your actual production was only 30 units.
Performance = (Total Produced Units x Ideal Cycle Time) / Actual Run Time
Thus, performance = (30 units x 0.2 hours) / 7 hours = 0.8571 (85.71%)
C) Quality
The quality is also known as process yield. It contrasts the good quality products with the total production. We discussed that you were able to produce 30 units in total. Now let’s say only 27 of them are of acceptable quality, and three turned out to be defective.
Quality = Good Units / Total Produced Units
Quality = 27 / 30 = 0.9 (90%).
Once you calculate these components, the calculation of OEE is easy.
Overall Equipment Effectiveness = Availability x Performance x Quality
OEE = 87.5% x 85.71% x 90% = 67.49%
An OEE score of 100% reflects that your equipment is at peak performance – no downtime, no defects and produced as fast as possible. OEE also shows the areas with the scope for improvement. Let’s say your performance is 95%, but the quality is 82%. It shows that you need to focus more on improving your production quality.
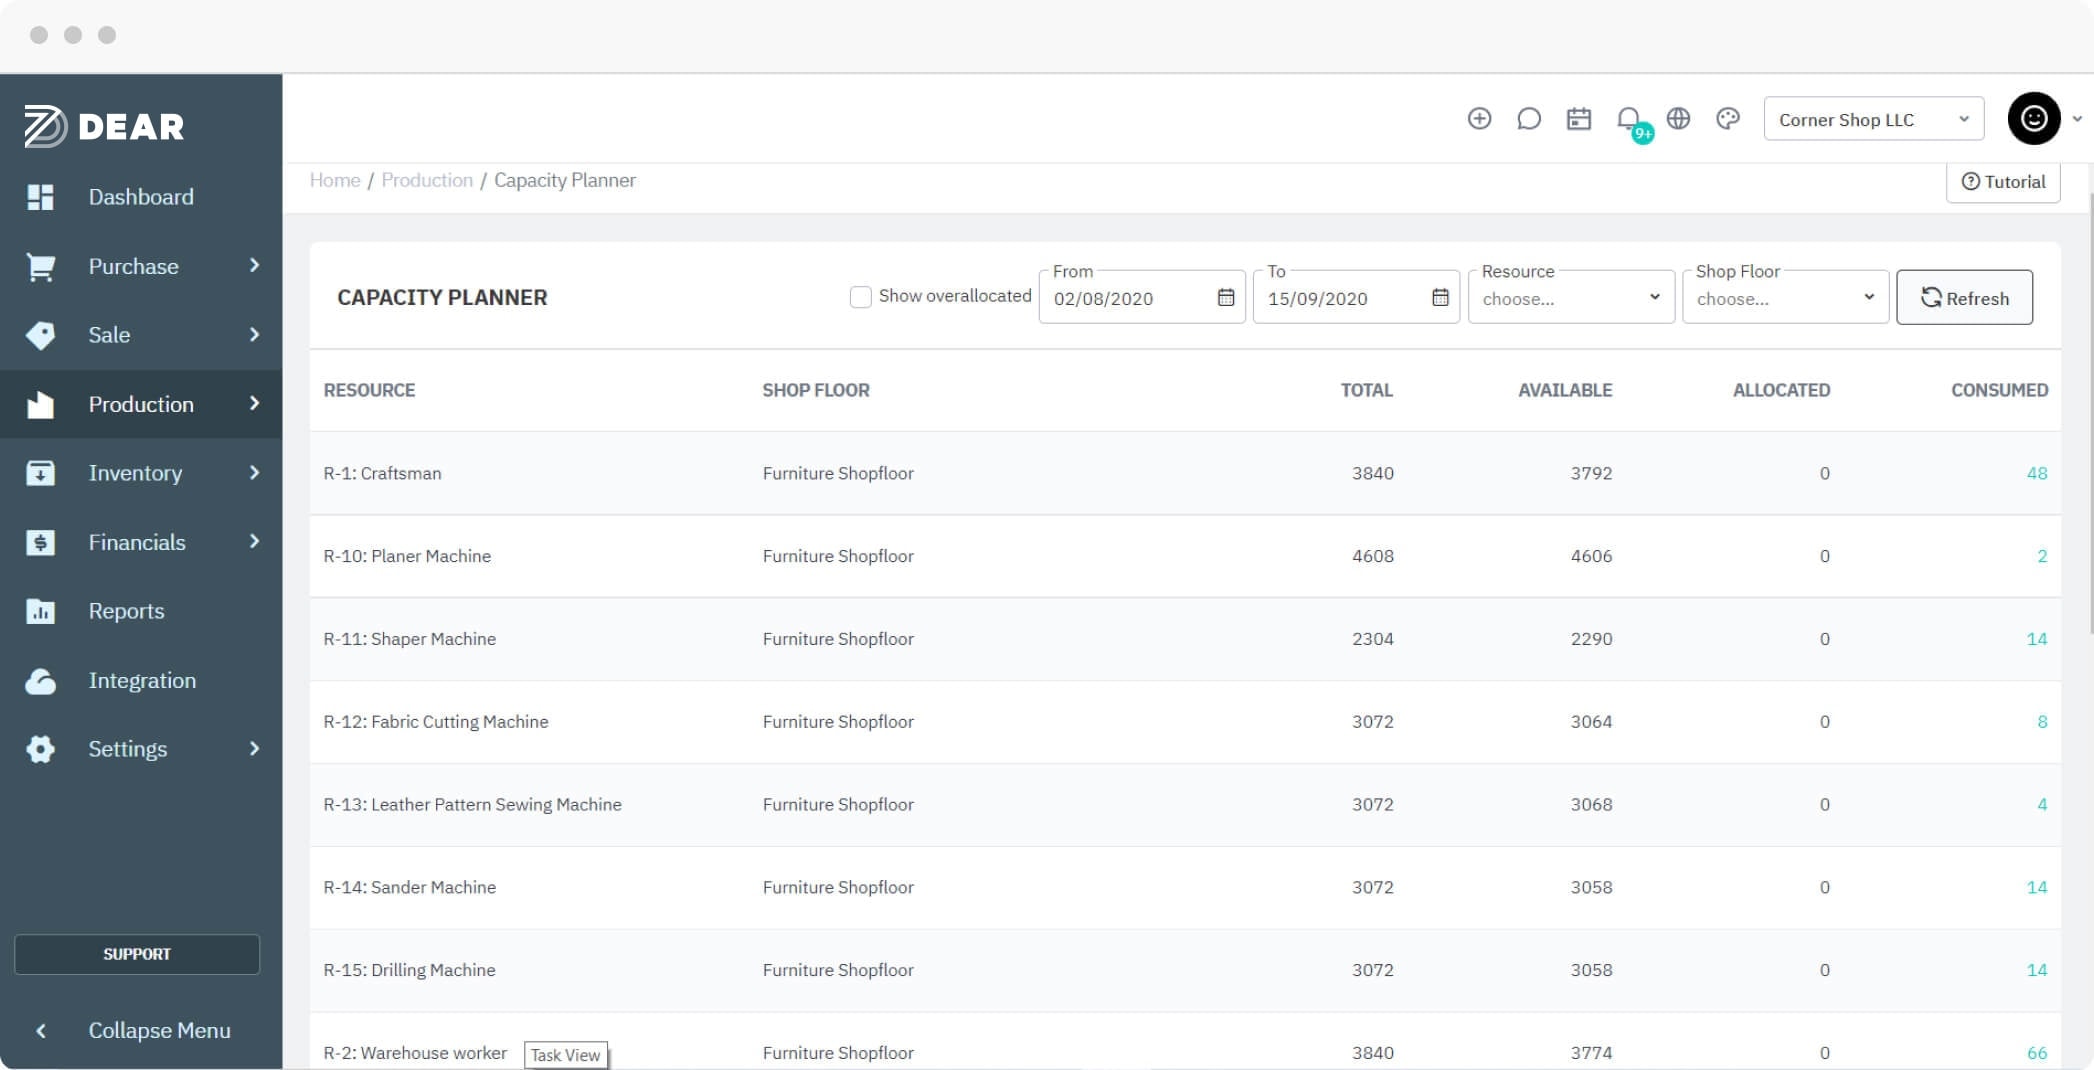
2. Capacity utilization
This metric shows how much of your plant’s total available capacity is currently used.
Capacity Utilization – Total Capacity Currently Used / Total Available Capacity
Let’s say you have 10 machines, but you are able to fill the current orders with just nine machines. Here, your capacity utilization is 90% (9 / 10).
Capacity utilization can come in handy when taking orders. You can determine whether you can handle the orders based on current capacity or if it requires expansion. With DEAR capacity planner, you can get insights into the capacity utilization of your resources.

3. Machinery downtime
Downtime refers to the time in which your equipment was not utilized. In contrast, uptime shows the time at which your machines were in operation.
It is crucial to monitor the downtime as it affects the availability of your equipment for production. Larger downtime means less time to produce, so it affects your production capability.
Machinery Downtime = Downtime / Total Operating Hours
Let’s say you have 480 weekly hours. Out of this, you faced downtime of 30 hours, so the downtime rate is 6.25% (30/480)
Employee KPIs
1. Employee turnover
Employee turnover deals with the number of people leaving your organization. You want to avoid high attrition as this can negatively impact your bottom line. After all, it takes time to find and train new employees. If there is high turnover, you should look into improving your organization’s culture or evaluate the compensation level.
Annual Turnover = Number of Employees Left / Average Number of Employees x 100
The average number of employees = Employees at the beginning of the year + Employees at the end of the year / 2
Let’s say 50 employees left your organization, and you have 400 employees on average. So annual turnover is 12.5% (50/400 x 100).
Customer KPIs
1. On-time delivery
Customers make or break your business. Of course, your customers expect timely delivery of their ordered items. You should thoroughly audit your delivery performance, and the on-time delivery KPI can help with this. It shows the percentage of timely deliveries you had in contrast to the total number of deliveries.
On-Time Delivery = Deliveries On Time / Total Deliveries x 100
For example, if 93 out of 100 orders were delivered on time, the on-time delivery rate would be 93%.
2. Customer returns
You should also keep tabs on the returns from your customers and find the root cause of such returns. If you sent the wrong item, you need to work on the order-picking process. If it is because of defective products, you need to check with your delivery partner to reduce transit damage. You should also appropriately package the items to safeguard them from transit damage.
DEAR Systems to maximize your manufacturing performance
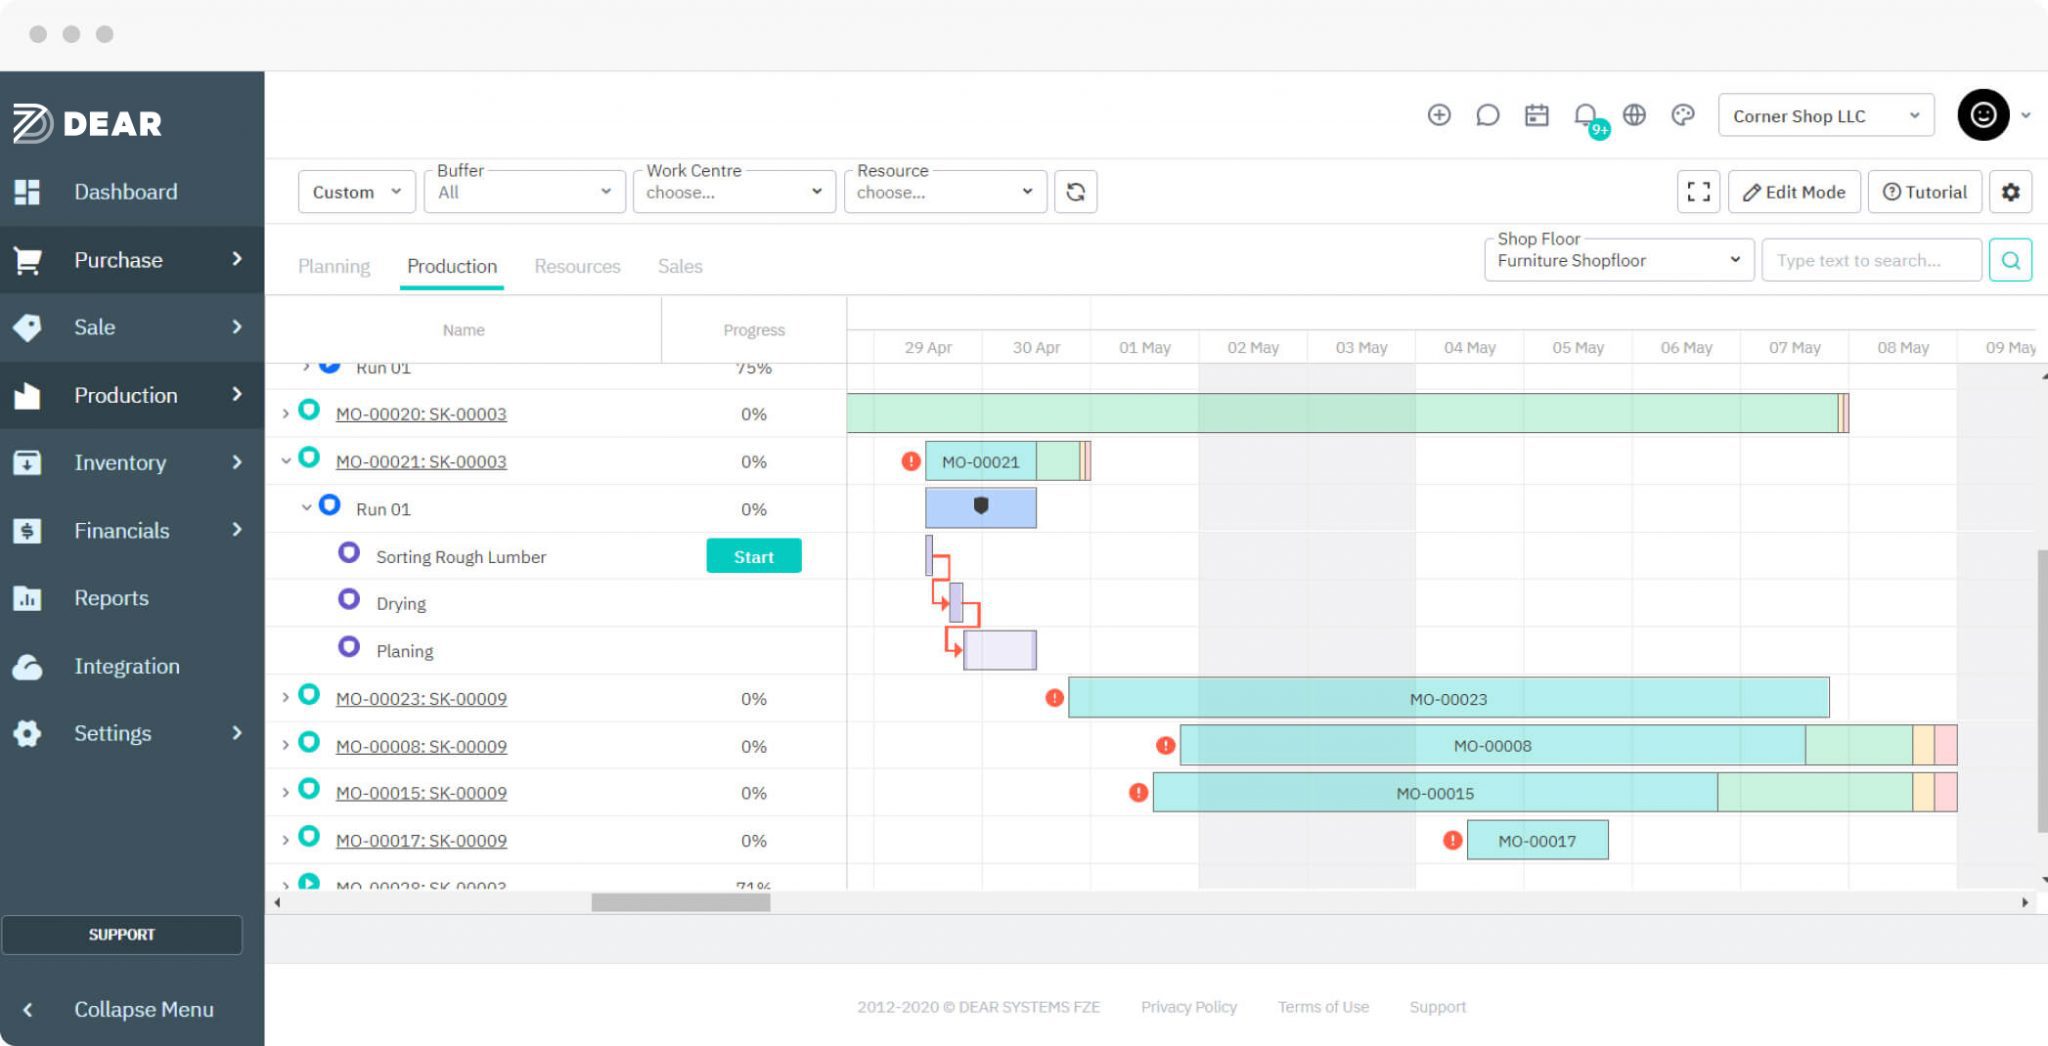
You should yearly review these KPIs to better gauge the performance of your manufacturing unit. To optimize your overall production process, you can implement DEAR Systems.
DEAR Systems allows you to monitor your entire production process from a single dashboard. You can compare the time taken to complete each step with the estimated production time.

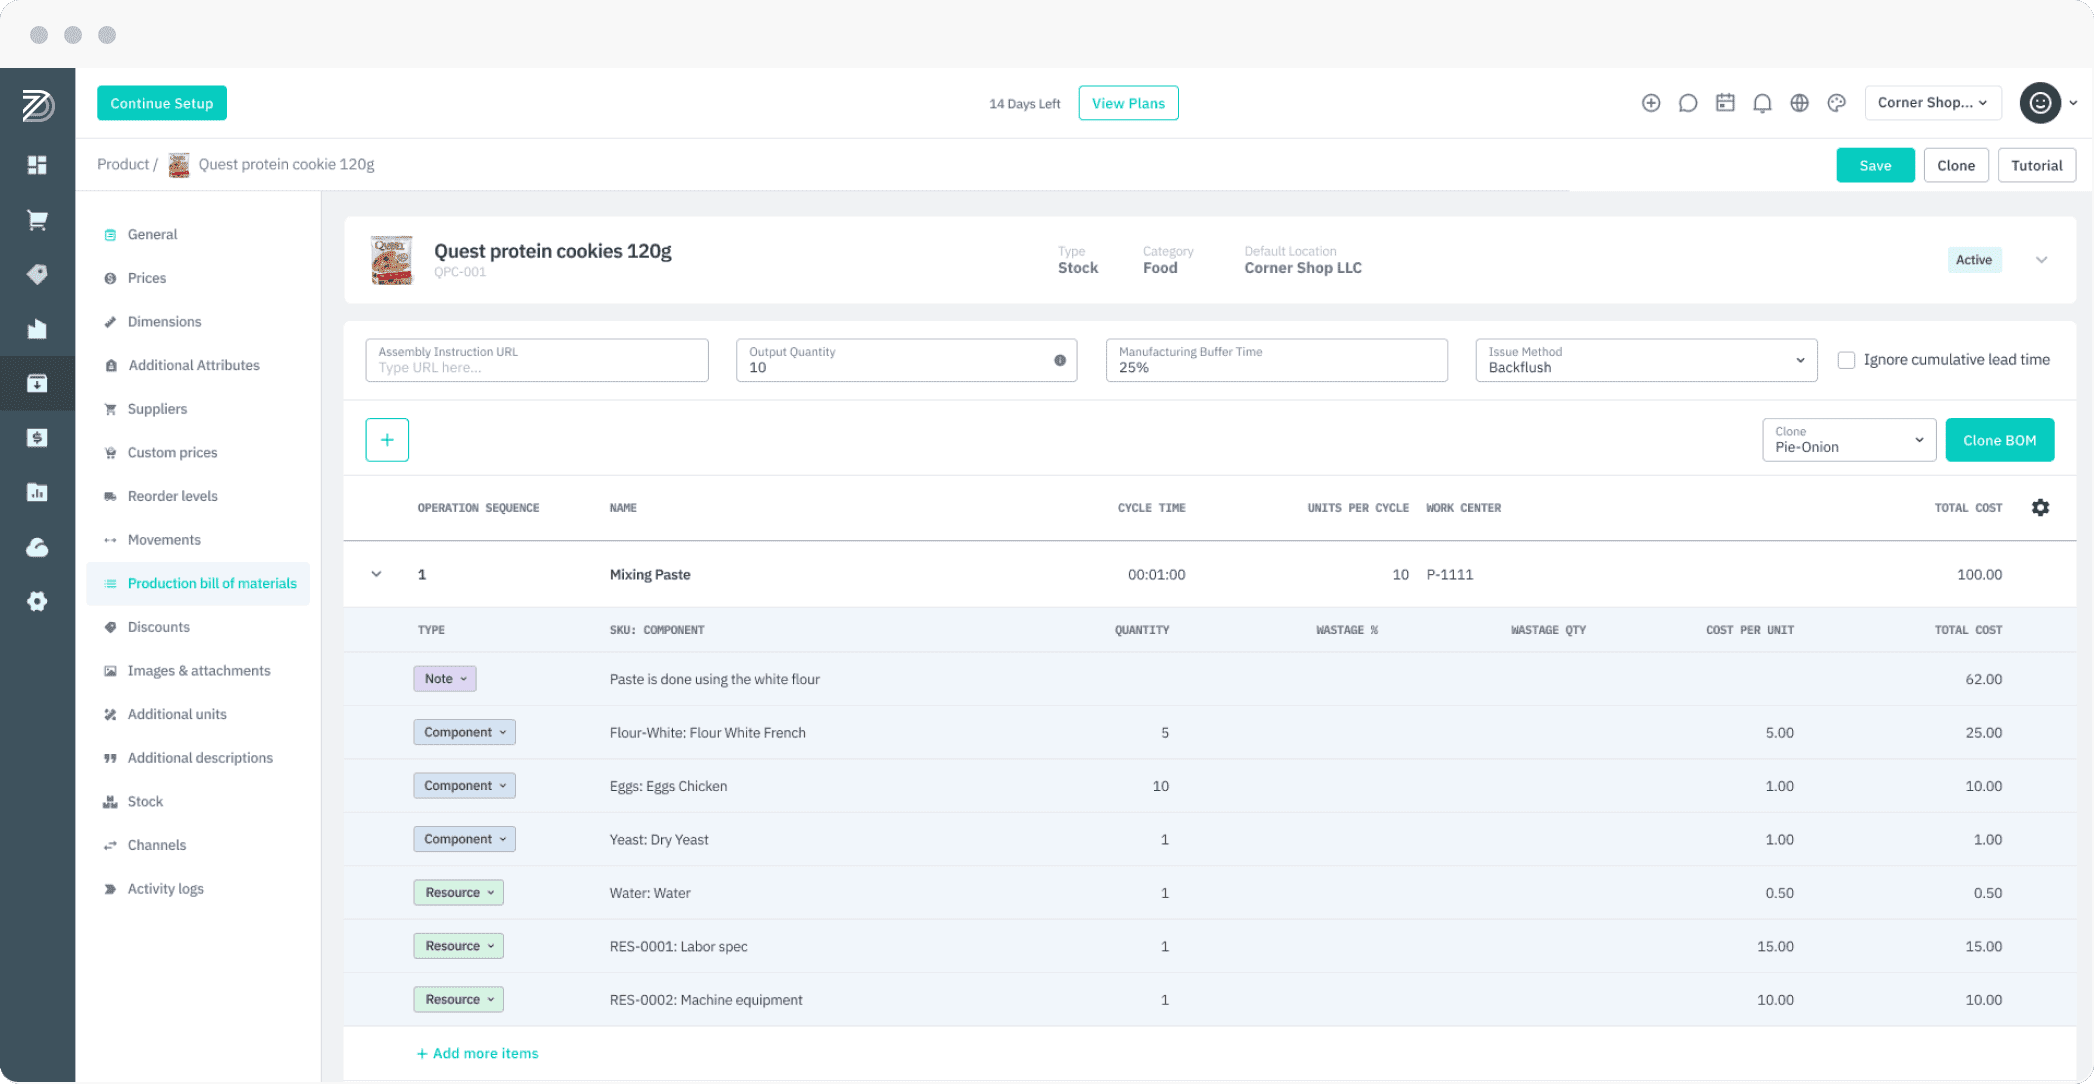
You can create a bill of materials to break down the components required for production. It also shows the associated cost and available quantities for every item. By keeping tabs on the available units, you can replenish them on time, ensuring that your production runs smoothly.

We have a lot more features that can help you take your production to the next level. Book a call with our experts now to learn more about DEAR Systems.